

Normal Blood Sugar Levels by Age: 5 Essential Charts
One in three adults in the UK has prediabetes. Most have no idea. Blood sugar can sit in the prediabetic range for years, quietly accelerating insulin resistance, cardiovascular risk, and weight gain, without producing a single obvious symptom. By the time a diagnosis lands, the damage is often a decade in the making.
Knowing your numbers changes that picture completely. Normal blood sugar levels by age are not a single fixed target. Where you sit on the spectrum, how your age changes what’s expected, and what truly healthy glucose looks like around the clock all matter. A reading that’s reassuring at 25 looks different at 65.
This guide covers the standard diagnostic ranges for fasting glucose, postprandial glucose, and HbA1c across different life stages. It explains how blood sugar naturally shifts with age, uses CGM (continuous glucose monitor) data from healthy non-diabetic adults to show what optimal control looks like in practice, and tells you exactly which tests to ask for.
What “Normal” Blood Sugar Actually Means
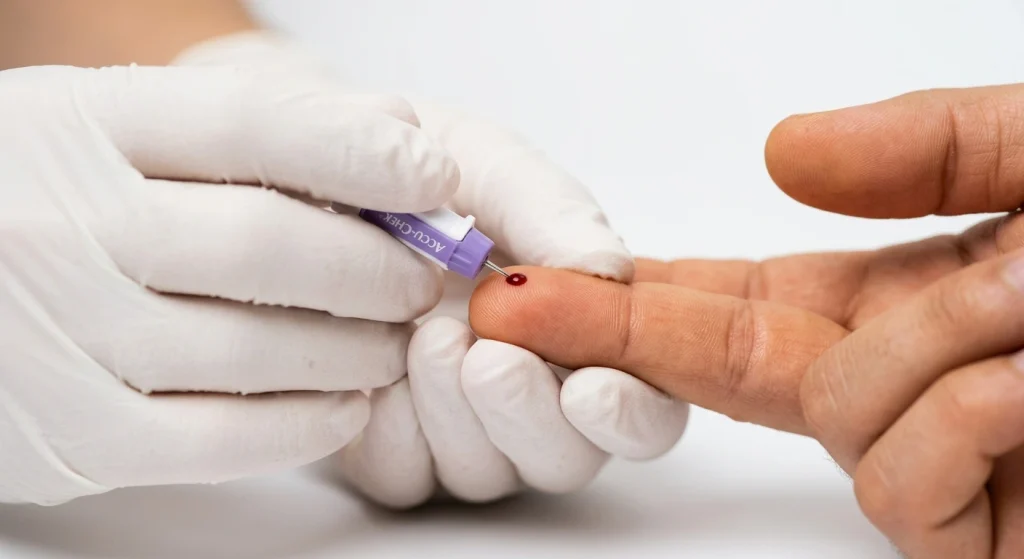
Blood sugar is not a single number. It is a moving target that changes throughout the day in response to food, exercise, sleep, stress, and the passage of time since your last meal. Three different tests capture different parts of that picture, and each tells you something the others cannot.
Fasting blood glucose measures your blood sugar after at least eight hours without food. It reflects your baseline: how well your liver manages glucose output overnight and how sensitive your cells remain to insulin when no food is being digested.
Postprandial blood glucose measures blood sugar one to two hours after eating. It shows how effectively your body clears glucose from a meal. This is often where early metabolic dysfunction shows up first, before fasting glucose is affected at all. Many people with normal fasting readings have postprandial spikes that indicate early insulin resistance.
HbA1c (glycated haemoglobin) reflects your average blood glucose over the previous two to three months. It captures a longer-term picture that a single reading cannot provide. Because it reflects cumulative exposure, HbA1c catches patterns that a one-off fasting test will miss.
| Test | When Measured | What It Captures | Units |
|---|---|---|---|
| Fasting glucose | After 8+ hours without food | Baseline / overnight glucose management | mmol/L or mg/dL |
| Postprandial glucose | 1–2 hours after eating | Meal clearance and insulin response | mmol/L or mg/dL |
| HbA1c | Any time (blood draw) | 2–3 month glucose average | Percentage (%) |
Understanding which test to use, and when, is the first step in interpreting what normal blood sugar levels by age should look like for you specifically.
The Standard Diagnostic Ranges for Adults
These are the ranges published by the American Diabetes Association and used by most clinical guidelines internationally.
Chart 1: Fasting Blood Glucose Ranges
| Category | mmol/L | mg/dL |
|---|---|---|
| Normal | 3.9 – 5.5 | 70 – 99 |
| Prediabetes (IFG) | 5.6 – 6.9 | 100 – 125 |
| Diabetes | 7.0 or above | 126 or above |
Chart 2: Postprandial Blood Glucose Ranges (2 Hours After Eating)
| Category | mmol/L | mg/dL |
|---|---|---|
| Normal | Below 7.8 | Below 140 |
| Prediabetes (IGT) | 7.8 – 11.0 | 140 – 199 |
| Diabetes | 11.1 or above | 200 or above |
Post-meal glucose is often the first number to drift out of range. A 2025 review published in PMC confirmed that postprandial glucose variability is an independent risk factor for cardiovascular disease and should be monitored alongside fasting values.
Chart 3: HbA1c Ranges
| Category | HbA1c (%) |
|---|---|
| Normal | Below 5.7% |
| Prediabetes | 5.7% – 6.4% |
| Diabetes | 6.5% or above |
These ranges apply across adult age groups as diagnostic cut-offs. However, what’s typical and what’s optimal shifts considerably with age. The numbers above define the clinical thresholds. Normal blood sugar levels by age, in practical terms, look somewhat different at each life stage.
How Normal Blood Sugar Levels Change by Age
Age is one of the most consistent predictors of fasting and postprandial glucose in non-diabetic adults. Muscle mass declines with age, reducing the body’s capacity to absorb glucose. Insulin secretion becomes slightly less responsive. The liver’s overnight glucose regulation becomes less precise.
Understanding these shifts matters because the standard diagnostic thresholds don’t change. A fasting glucose of 5.8 mmol/L is not diagnostic of anything. But it means something different in a 28-year-old than a 68-year-old.

Children and Adolescents
Children use the same diagnostic thresholds as adults for prediabetes and diabetes. Normal fasting glucose sits in the 3.9 to 5.5 mmol/L range. In practice, a healthy ten-year-old’s fasting glucose almost always sits below 5.0 mmol/L. Readings above 5.5 mmol/L in children warrant investigation even when they fall within the technical normal range for adults, because this age group has significant physiological reserve.
Normal blood sugar levels by age for children should trend toward the lower end of the adult normal range. Post-meal glucose in healthy children typically peaks lower and returns to baseline faster than in adults, because insulin secretion is more robust and peripheral insulin sensitivity is higher.
Adults Aged 18 to 45
This is where metabolic health is typically at its peak in people without underlying conditions. A genuinely optimal fasting glucose for this age group sits between 4.0 and 5.0 mmol/L. Post-meal glucose should return to baseline within two hours.
Peaks above 7.5 mmol/L after a moderate carbohydrate meal suggest reduced insulin sensitivity, even when the two-hour reading falls back within the normal range. For this age group, normal blood sugar levels by age should comfortably sit within the lower half of the standard normal range.
Adults Aged 45 to 60
A study published in PMC found that fasting plasma glucose increases by approximately 0.15 mmol/L per decade of age, and two-hour postprandial glucose increases by 0.26 mmol/L per decade.
These are not dramatic shifts, but they compound. By age 55, fasting glucose of 5.3 to 5.6 mmol/L is common in people without diagnosed metabolic conditions, and the diagnostic threshold for prediabetes (5.6 mmol/L) becomes easier to cross without obvious clinical disease. Normal blood sugar levels by age in this bracket are edging closer to the diagnostic thresholds, which is exactly why screening from age 45 is recommended.
Adults Aged 60 and Above
Fasting glucose in non-diabetic adults over 60 commonly sits between 5.0 and 5.9 mmol/L. Post-meal glucose spikes tend to be larger and take longer to resolve. Kidney glucose handling also changes with age, which can affect how glucose is cleared.
For this group, the standard diagnostic thresholds are unchanged. But context matters. A fasting glucose of 5.9 mmol/L in an otherwise healthy, physically active 70-year-old with normal HbA1c is a different situation from the same reading in a sedentary individual with elevated triglycerides and a large waist circumference.
Chart 4: Normal Blood Sugar Levels by Age Group (Non-Diabetic, No Medications)
| Age Group | Typical Fasting Range | Optimal Target |
|---|---|---|
| Children / adolescents | 3.9 – 5.0 mmol/L | Below 5.0 |
| Adults 18–44 | 4.0 – 5.4 mmol/L | Below 5.0 |
| Adults 45–59 | 4.4 – 5.7 mmol/L | Below 5.3 |
| Adults 60–74 | 4.6 – 5.9 mmol/L | Below 5.5 |
| Adults 75+ | 5.0 – 6.1 mmol/L | Below 5.8 |
The “optimal target” column reflects what CGM data from healthy non-diabetic adults shows, rather than the clinical threshold for prediabetes. The difference is meaningful. Meeting a threshold is not the same as being metabolically healthy.
What CGM Data Shows About Truly Healthy Blood Sugar
Standard diagnostic tests give you snapshots. CGM gives you the continuous film.
A multicenter prospective study published in PMC measured CGM profiles in healthy, non-diabetic adults of normal weight. The mean 24-hour glucose was 5.5 mmol/L. These people spent 96% of their time with sensor glucose between 3.9 and 7.8 mmol/L. After meals, peak glucose reached approximately 7.3 mmol/L before returning to baseline within two hours.
These numbers set a more granular standard than the fasting-only picture that clinical guidelines focus on. Normal blood sugar levels by age in truly healthy individuals, as defined by CGM, show far less variability than people assume. The glucose curve stays relatively flat between meals, rises modestly after eating, and returns to baseline quickly.
Chart 5: CGM Reference Metrics for Healthy Non-Diabetic Adults
| CGM Metric | Healthy Reference Range |
|---|---|
| Mean 24-hour glucose | 5.0 – 5.7 mmol/L (90 – 103 mg/dL) |
| Time in range (3.9 – 7.8 mmol/L) | 96% or above |
| Post-meal glucose peak | Below 7.5 mmol/L (135 mg/dL) |
| Time to return to baseline after meals | Within 2 hours |
| Time below 3.9 mmol/L | Less than 1% |
| Time above 7.8 mmol/L | Less than 4% |
CGM data is particularly revealing for the “normal but not optimal” zone. Someone with a fasting glucose of 5.4 mmol/L and an HbA1c of 5.5% could still be spending meaningful time above 7.8 mmol/L after meals, with glucose variability that predicts metabolic risk even within the technically normal range.

Factors That Affect Blood Sugar Beyond Age
Normal blood sugar levels by age are the starting point. Several other factors push glucose readings higher or lower independently of age and diagnosis:
Sleep. A single night of poor sleep raises fasting glucose and reduces insulin sensitivity by 20 to 25% in otherwise healthy adults. The article on how sleep affects metabolic health covers the mechanisms in detail. For anyone trying to interpret their own numbers, sleep quality in the days before a test matters.
Stress. Cortisol raises blood glucose by promoting glycogen breakdown in the liver and reducing peripheral insulin sensitivity. Chronic stress elevates both fasting and postprandial glucose independently of diet. Our article on cortisol and belly fat explains how this connects to body composition.
Exercise timing. A 20-minute walk after meals significantly reduces postprandial glucose spikes. Resistance training increases GLUT4 expression in muscle cells, improving the rate at which glucose is cleared between meals. The natural approaches to insulin sensitivity article covers both exercise and dietary strategies together.

Diet composition. The glycaemic load of individual meals directly determines postprandial peaks. A meal high in refined carbohydrates produces a much larger and faster glucose spike than a protein and fat-rich meal with the same calorie count.
Medications. Corticosteroids, antipsychotics, and some antihypertensives can raise fasting glucose. Beta-blockers may mask symptoms of hypoglycaemia. Always interpret blood sugar readings in the context of any current medications.
Understanding these variables helps explain why normal blood sugar levels by age look different across individuals even within the same age bracket. The charts provide population-level reference points. Individual context determines what any particular reading means.
When to Get Tested and What to Ask For
Most clinical guidelines recommend blood sugar screening for all adults from age 35, every three years if results are normal. Earlier testing is recommended with any of the following: family history of type 2 diabetes, significant abdominal fat, history of gestational diabetes, PCOS, high blood pressure, or history of cardiovascular disease.
Ask specifically for fasting plasma glucose and HbA1c together. Neither alone tells the whole story. Adding a fasting insulin level lets you calculate HOMA-IR, the most sensitive way to detect insulin resistance before glucose readings are affected. HOMA-IR above 2.5 indicates meaningful insulin resistance even when fasting glucose appears normal.
Interpreting normal blood sugar levels by age accurately means having the right tests in the first place. Most standard health checks measure fasting glucose only. That catches overt diabetes and some prediabetes, but misses the earlier insulin resistance phase where intervention is most effective.
Frequently Asked Questions
What are normal blood sugar levels by age?
Normal blood sugar levels by age follow broadly consistent diagnostic thresholds across adulthood, but typical values shift with age. For fasting glucose, adults aged 18 to 44 ideally sit below 5.0 mmol/L. Adults aged 45 to 59 commonly run 4.4 to 5.7 mmol/L. Those aged 60 and above often sit between 4.6 and 5.9 mmol/L. The clinical diagnostic threshold for prediabetes remains 5.6 mmol/L regardless of age.
What is a normal fasting blood sugar level?
For adults, a normal fasting blood glucose is between 3.9 and 5.5 mmol/L (70 to 99 mg/dL). A reading between 5.6 and 6.9 mmol/L indicates prediabetes. A reading of 7.0 mmol/L or above on two separate tests meets the diagnostic criteria for type 2 diabetes.
Do blood sugar levels increase with age?
Yes. Research shows fasting blood glucose rises by approximately 0.15 mmol/L per decade in non-diabetic adults, and two-hour postprandial glucose rises by around 0.26 mmol/L per decade. These increases do not change the diagnostic thresholds for prediabetes or diabetes, but they mean that a reading close to the threshold carries more weight in a younger person than an older one.
What blood sugar level is considered prediabetes?
Prediabetes is diagnosed when any one of the following applies: fasting glucose of 5.6 to 6.9 mmol/L; two-hour postprandial glucose of 7.8 to 11.0 mmol/L on an oral glucose tolerance test; or HbA1c of 5.7% to 6.4%.
What is a normal blood sugar level two hours after eating?
A normal two-hour postprandial glucose is below 7.8 mmol/L (140 mg/dL). CGM data from healthy adults shows that an optimal post-meal glucose peaks below 7.5 mmol/L and returns to baseline within two hours. Post-meal readings are often the first sign of declining insulin sensitivity, even when fasting glucose remains normal.
What is a normal HbA1c level?
An HbA1c below 5.7% is considered normal. Between 5.7% and 6.4% indicates prediabetes. An HbA1c of 6.5% or above on two separate tests confirms diabetes. For context, CGM data from metabolically healthy adults typically corresponds to an HbA1c of 5.0 to 5.4%, well below the prediabetes threshold.
Can blood sugar be too low?
Yes. Blood glucose below 3.9 mmol/L (70 mg/dL) is considered hypoglycaemia. In people without diabetes or blood-sugar-lowering medication, significant hypoglycaemia is uncommon but can occur with prolonged fasting, extreme exercise, or excessive alcohol intake.
Conclusion
Normal blood sugar levels by age are not a single fixed target. Fasting glucose, post-meal glucose, and HbA1c each capture a different window of metabolic health. The CGM data from healthy non-diabetic adults sets a clear bar: mean 24-hour glucose around 5.5 mmol/L, post-meal peaks below 7.5 mmol/L, and 96% of time within range. That is what genuinely good glucose control looks like.
Age shifts where most people sit within these ranges, but it does not change what optimal means. A 55-year-old with a fasting glucose of 5.8 mmol/L is in a different position to a 25-year-old with the same reading. The charts in this guide give you the context to interpret that difference.
If your numbers are creeping toward the upper end of normal, the lifestyle strategies in our guides to natural approaches to insulin sensitivity and how to lower insulin naturally are the most evidence-backed place to start.
